Processing: Titanic
Task:
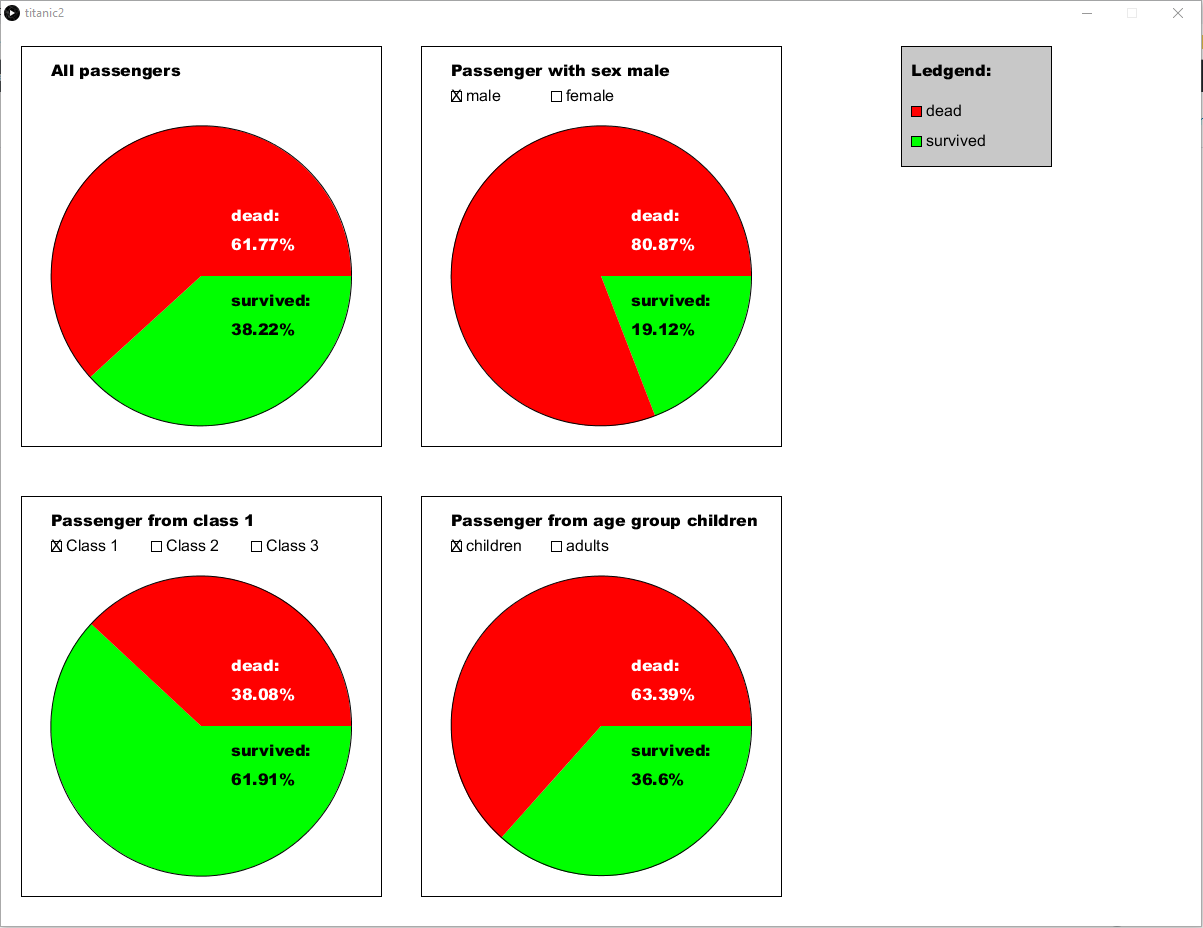
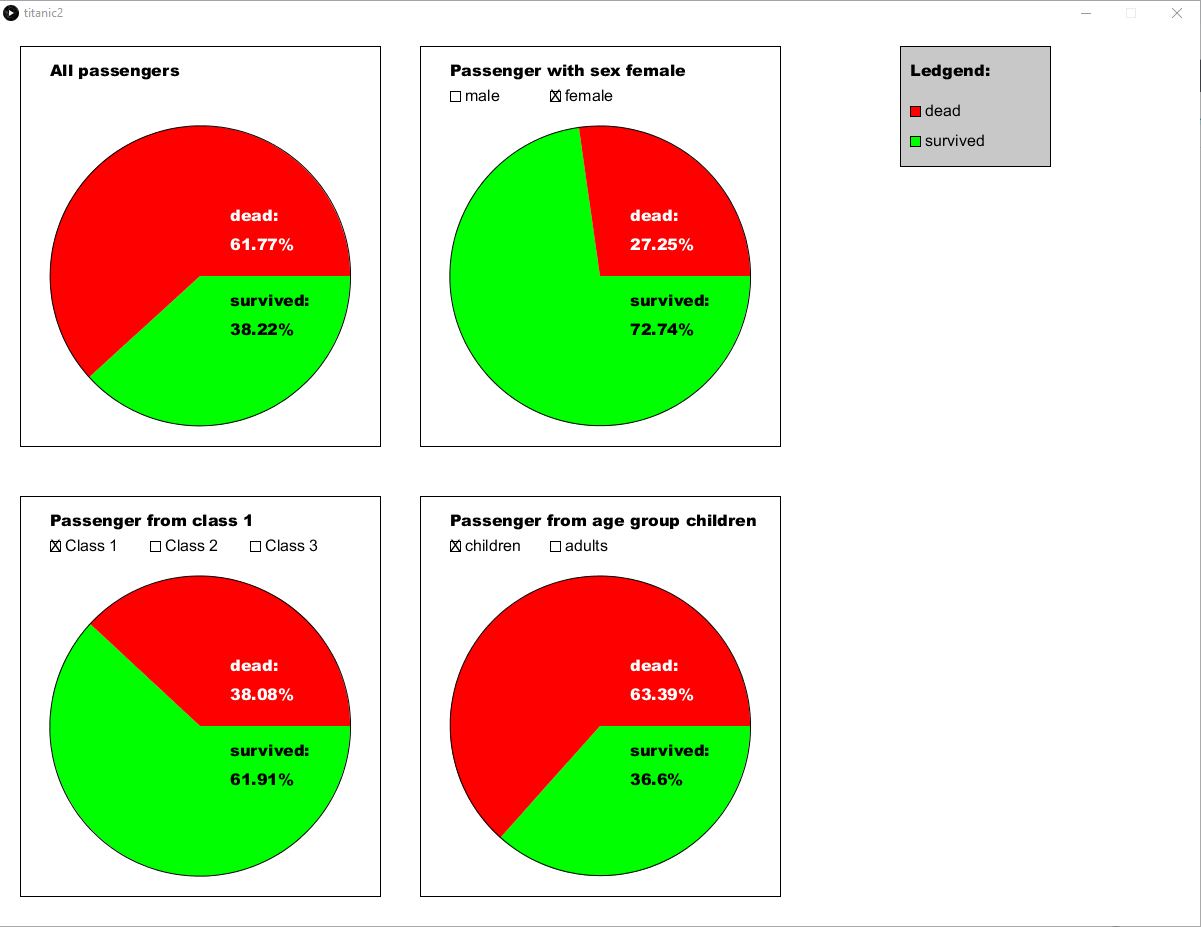
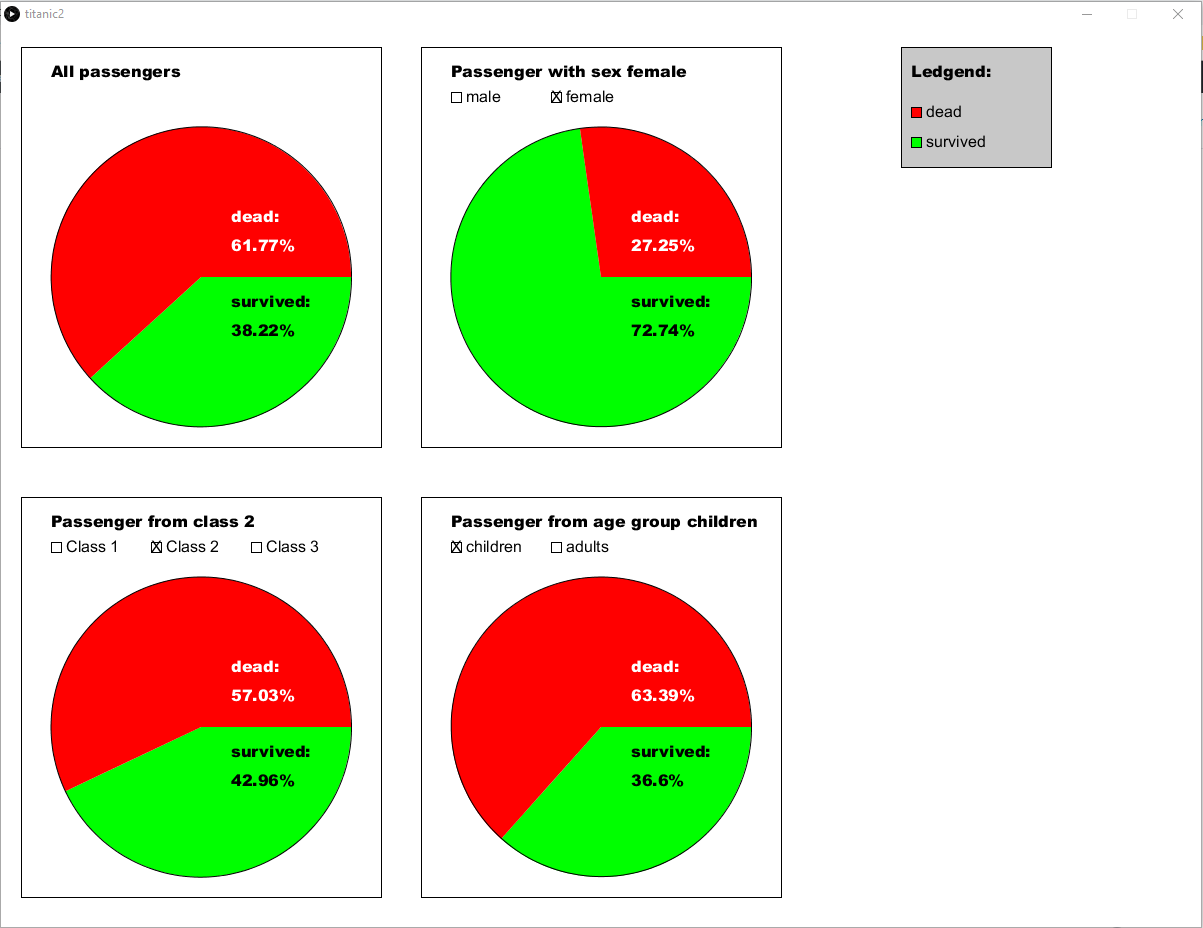
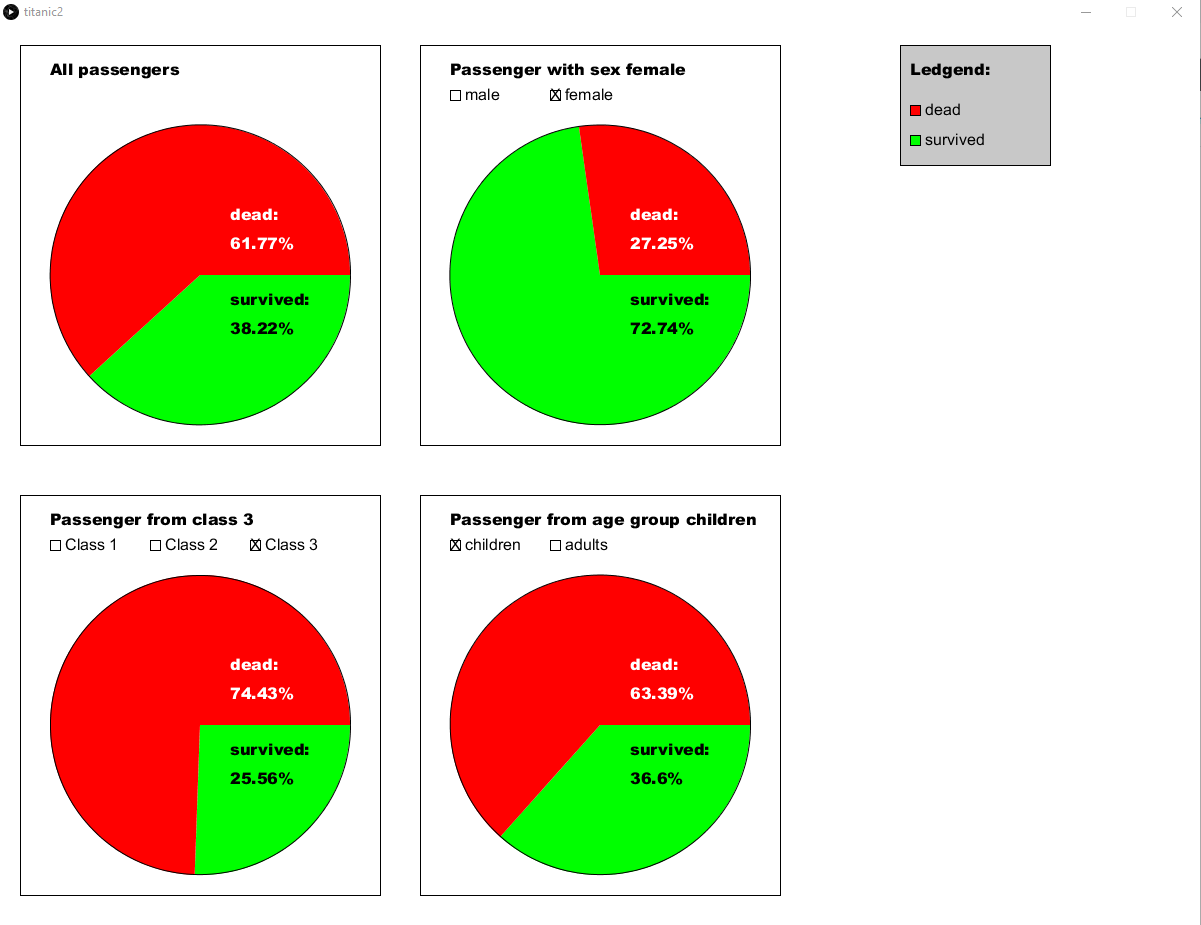
Show the data about how many people survived and how many people died at the Titanic. Use the data from a given file and implement it using Processing.
Description of the solution:
This program focus on the interaction with the user to visualize the data of the Titanic.
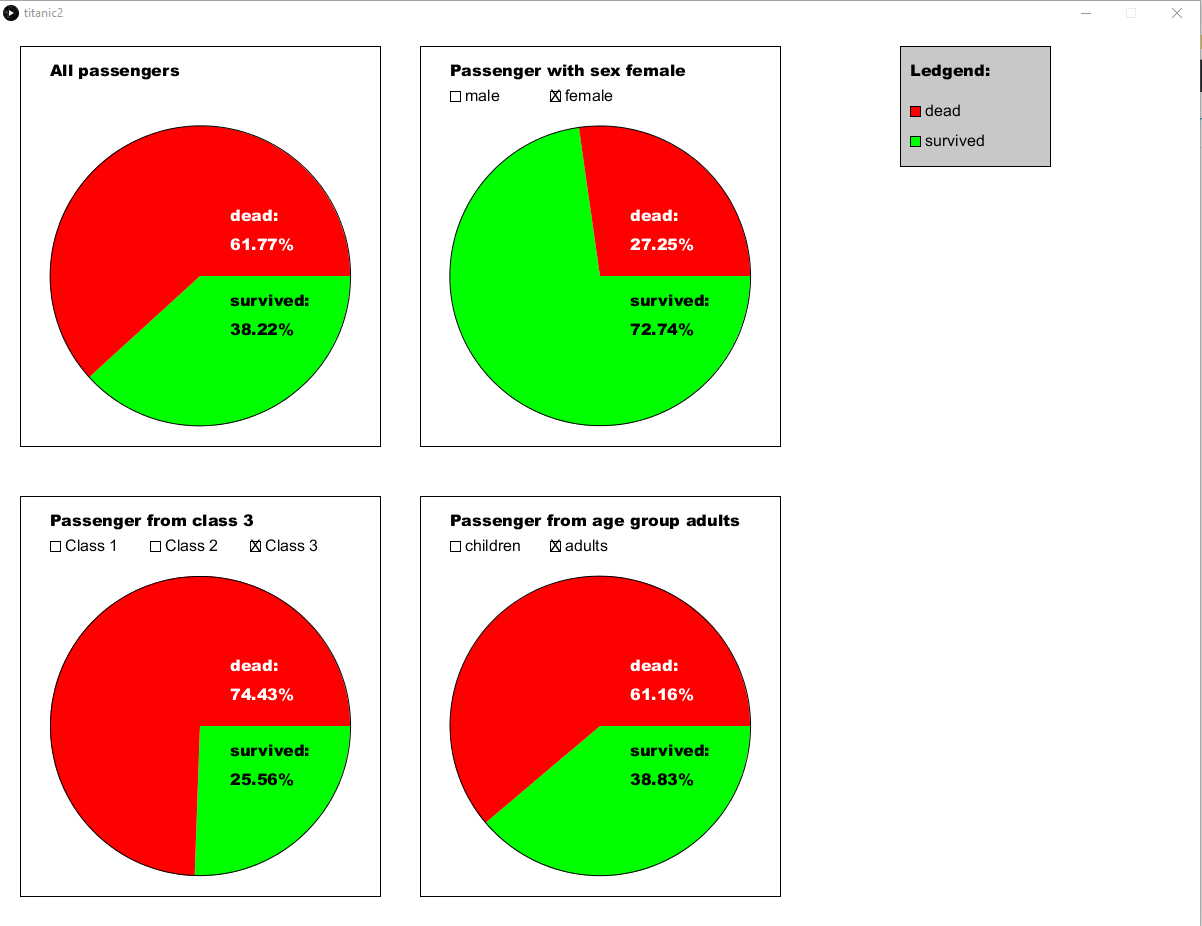
I used pie charts to show the percentage of how many people survived and how many died. Therefore, there are four pie charts. The first one shows the percentages for all passengers. In the second to fourth one you can choose by clicking on the checkboxes from which sex (second pie chart), passenger class (third pie chart) or age group (fourth pie chart) you like to see the percentages in the pie chart.
Processing-Code: Titanic
//A class for Passengers to collect the data in one object
class Passenger {
  int pclass;
  int survived;
  String sex;
  float age;
  // Get dat
  Passenger(XML[ ]titanicData, int row) {
    XML pass = titanicData[row];
    this.pclass = pass.getChildren("Cell")[0].getIntContent();
    this.survived = pass.getChildren("Cell")[1].getIntContent();
    this.sex = pass.getChildren("Cell")[3].getContent();
    this.age = pass.getChildren("Cell")[4].getIntContent();
  }
}

// Declare some variables
public Passenger[] passengerList;
public int selectedClass = 1;
public String selectedSex = "male";
public int selectedMinAge = 0;
public int selectedMaxAge = 18;
public String selectedAge = "children";
public float[] allAngles;
public float[] pclassAngles;
public float[] sexAngles;
public float[] ageAngles;
public String allHead = "All passengers";
public String pclassHead;
public String sexHead;
public String ageHead;
public PFont b;
public PFont n;
public float red = 255;
public float green = 0;

void setup () {
  //Set the size and background of the programm
  size(1200, 900);
  background(255); //white

  //Load the File with all the data
  XML worksheet = loadXML("titanic passenger list.xml");
  XML[] rows = worksheet.getChildren("Worksheet")[0].getChildren("Table")[0].getChildren("Row");

  //Set the fonts
  b = createFont("Arial Black", 24, true);
  n = createFont("Arial", 24, true);

  //Implement a list for all passenger
  passengerList = new Passenger[1309];

  //Load the data from each passenger into a list of the object passenger
  for (int count = 0; count < 1309; count++) {
    passengerList[count] = new Passenger(rows, count);
  }
}

void draw () {
  //Count which survived and not survived
  float[] allStatus = countAll(passengerList);
  allAngles = getAngels(allStatus);

  float[] pclassStatus = countPclass(passengerList, selectedClass);
  pclassAngles = getAngels(pclassStatus);

  float[] sexStatus = countSex(passengerList, selectedSex);
  sexAngles = getAngels(sexStatus);

  float[] ageStatus = countAge(passengerList, selectedMinAge, selectedMaxAge);
  ageAngles = getAngels(ageStatus);

  //Draw the boarders around the pie charts and it's descriptions/choices
  fill(255);
  rect(20, 20, 360, 400);
  rect(20, 470, 360, 400);
  rect(420, 20, 360, 400);
  rect(420, 470, 360, 400);

  //Draw pie chart and text for all passenger
  fill(0);
  textFont(b, 16);
  text(allHead, 50, 50);
  pieChart(200, 250, 300, allAngles);

  //Draw pie chart and text for all passenger from selected class
  fill(0);
  pclassHead = "Passenger from class " + selectedClass;
  textFont(b, 16);
  text(pclassHead, 50, 500);
  textFont(n, 16);
  fill(255);
  if (selectedClass == 1) {
    fill(255);
    rect(50, 515, 10, 10);
    rect(150, 515, 10, 10);
    rect(250, 515, 10, 10);
    fill(0);
    text("X", 50, 525);
  } else if (selectedClass == 2) {
    fill(255);
    rect(50, 515, 10, 10);
    rect(150, 515, 10, 10);
    rect(250, 515, 10, 10);
    fill(0);
    text("X", 150, 525);
  } else if (selectedClass == 3) {
    fill(255);
    rect(50, 515, 10, 10);
    rect(150, 515, 10, 10);
    rect(250, 515, 10, 10);
    fill(0);
    text("X", 250, 525);
  }
  fill(0);
  text("Class 1", 65, 525);
  text("Class 2", 165, 525);
  text("Class 3", 265, 525);
  pieChart(200, 700, 300, pclassAngles);
  //Change selection of class by clicking on the check boxes
  if (mouseX > 50 && mouseX < 60 && mouseY > 515 && mouseY < 525 && mousePressed == true) {
    selectedClass = 1;
  } else if (mouseX > 150 && mouseX < 160 && mouseY > 515 && mouseY < 525 && mousePressed == true) {
    selectedClass = 2;
  } else if (mouseX > 250 && mouseX < 260 && mouseY > 515 && mouseY < 525 && mousePressed == true) {
    println("in");
    selectedClass = 3;
  }

  //Draw pie chart and text for all passenger from selected sex
  fill(0);
  sexHead = "Passenger with sex " + selectedSex;
  textFont(b, 16);
  text(sexHead, 450, 50);
  textFont(n, 16);
  if (selectedSex == "male") {
    fill(255);
    rect(450, 65, 10, 10);
    rect(550, 65, 10, 10);
    fill(0);
    text("X", 450, 75);
  } else if (selectedSex == "female") {
    fill(255);
    rect(450, 65, 10, 10);
    rect(550, 65, 10, 10);
    fill(0);
    text("X", 550, 75);
  }
  fill(0);
  text("male", 465, 75);
  text("female", 565, 75);
  pieChart(600, 250, 300, sexAngles);

  //Change selection of sex by clicking on the check boxes
  if (mouseX > 450 && mouseX < 460 && mouseY > 65 && mouseY < 75 && mousePressed == true) {
    selectedSex = "male";
  } else if (mouseX > 550 && mouseX < 560 && mouseY > 65 && mouseY < 75 && mousePressed == true) {
    selectedSex = "female";
  }

  //Draw pie chart and text for all passenger from selected age group
  fill(0);
  ageHead = "Passenger from age group " + selectedAge;
  textFont(b, 16);
  text(ageHead, 450, 500);
  textFont(n, 16);

  if (selectedAge == "children") {
    selectedMinAge = 0;
    selectedMaxAge = 18;
    fill(255);
    rect(450, 515, 10, 10);
    rect(550, 515, 10, 10);
    fill(0);
    text("X", 450, 525);
  } else if (selectedAge == "adults") {
    selectedMinAge = 18;
    selectedMaxAge = 90;
    fill(255);
    rect(450, 515, 10, 10);
    rect(550, 515, 10, 10);
    fill(0);
    text("X", 550, 525);
  }
  fill(0);
  text("children", 465, 525);
  text("adults", 565, 525);
  pieChart(600, 700, 300, ageAngles);

  //Change selection of age group by clicking on the check boxes
  if (mouseX > 450 && mouseX < 460 && mouseY > 515 && mouseY < 525 && mousePressed == true) {
    selectedAge = "children";
  } else if (mouseX > 550 && mouseX < 560 && mouseY > 515 && mouseY < 525 && mousePressed == true) {
    selectedAge = "adults";
  }

  //Draw the ledgend
  fill(200);
  rect(900, 20, 150, 120);
  fill(0);
  textFont(b, 16);
  text("Ledgend:", 910, 50);

  textFont(n, 16);

  fill(255, 0, 0);
  rect(910, 80, 10, 10);
  fill(0);
  text("dead", 925, 90);

  fill(0, 255, 0);
  rect(910, 110, 10, 10);
  fill(0);
  text("survived", 925, 120);
}


// Returns the values for angels for a pie chart from given valus
public float[] getAngels(float[] status) {
  float total = status[0];
  float alive = status[1];
  float dead = status[2];

  float degreeAlive = (alive / total) * 360;
  float degreeDead = (dead / total) * 360;

  float percentAlive = (alive / total) * 100;
  float percentDead = (dead / total) * 100;

  float[] angeles = {degreeAlive, degreeDead, percentAlive, percentDead};
  return angeles;
}

//Returns the amount of survived and not survived passengers in a given class
public float[] countPclass(Passenger[] passengerList, int choiceClass) {
  float live = 0;
  float dead = 0;
  float total = 0;
  for (int i = 1; i < passengerList.length; i++) {
    if (passengerList[i].pclass == choiceClass) {
      total++;
      if (passengerList[i].survived == 1) {
        live++;
      } else {
        dead++;
      }
    }
  }
  float[] status = {total, live, dead};
  return status;
}

//Returns the amount of survived and not survived passengers within a given age
public float[] countAge(Passenger[] passengerList, int choiceMinAge, int choiceMaxAge) {
  float live = 0;
  float dead = 0;
  float total = 0;
  for (int i = 1; i < passengerList.length; i++) {
    if (passengerList[i].age >= choiceMinAge && passengerList[i].age <= choiceMaxAge) {
      total++;
      if (passengerList[i].survived == 1) {
        live++;
      } else {
        dead++;
      }
    }
  }
  float[] status = {total, live, dead};
  return status;
}

//Returns the amount of survived and not survived passengers with a given sex
public float[] countSex(Passenger[] passengerList, String choiceSex) {
  float live = 0;
  float dead = 0;
  float total = 0;
  for (int i = 1; i < passengerList.length; i++) {
    if (passengerList[i].sex.equals(choiceSex)) {
      total++;
      if (passengerList[i].survived == 1) {
        live++;
      } else {
        dead++;
      }
    }
  }
  float[] status = {total, live, dead};
  return status;
}


//Returns the amount of survived and not survived passengers at all
public float[] countAll(Passenger[] passengerList) {
  float live = 0;
  float dead = 0;
  float total = 0;
  for (int i = 1; i < passengerList.length; i++) {
    total++;
    if (passengerList[i].survived == 1) {
      live++;
    } else {
      dead++;
    }
  }
  float[] status = {total, live, dead};
  return status;
}

//Create the pie chart --> The example at https://www.processing.org/examples/piechart.html
void pieChart(float x, float y, float diameter, float[] angels) {
  /* Source: https://processing.org/examples/piechart.html*/
  float lastAngle = 0;
  for (int i = 0; i < 2; i++) {
    if (red == 255) {
      red = 0;
    } else {
      red = 255;
    }
    if (green == 255) {
      green = 0;
    } else {
      green = 255;
    }
    fill(red, green, 0);
    arc(x, y, diameter, diameter, lastAngle, lastAngle+radians(angels[i]));
    lastAngle += radians(angels[i]);
  }
  textFont(b, 16);
  fill(0);
  text("survived:" + "\n" + (float)(((int)(angels[2]*100))/100.0) + "%", x+30, y+30);
  fill(255);
  text("dead: " + "\n" + (float)(((int)(angels[3]*100))/100.0) + "%", x+30, y-55);
}
Here you can download a ZIP-Folder with the complete program:

