R: Titanic
Task:
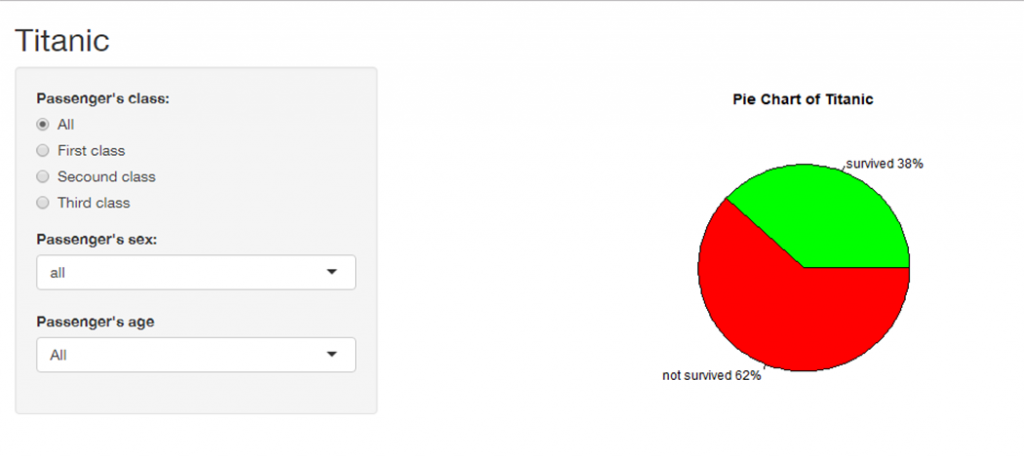
Show the data about how many people survived and how many people died at the Titanic. Use the data from a given file. This time show how it could look with Shiny in R to present it to the course.
Description of the solution:
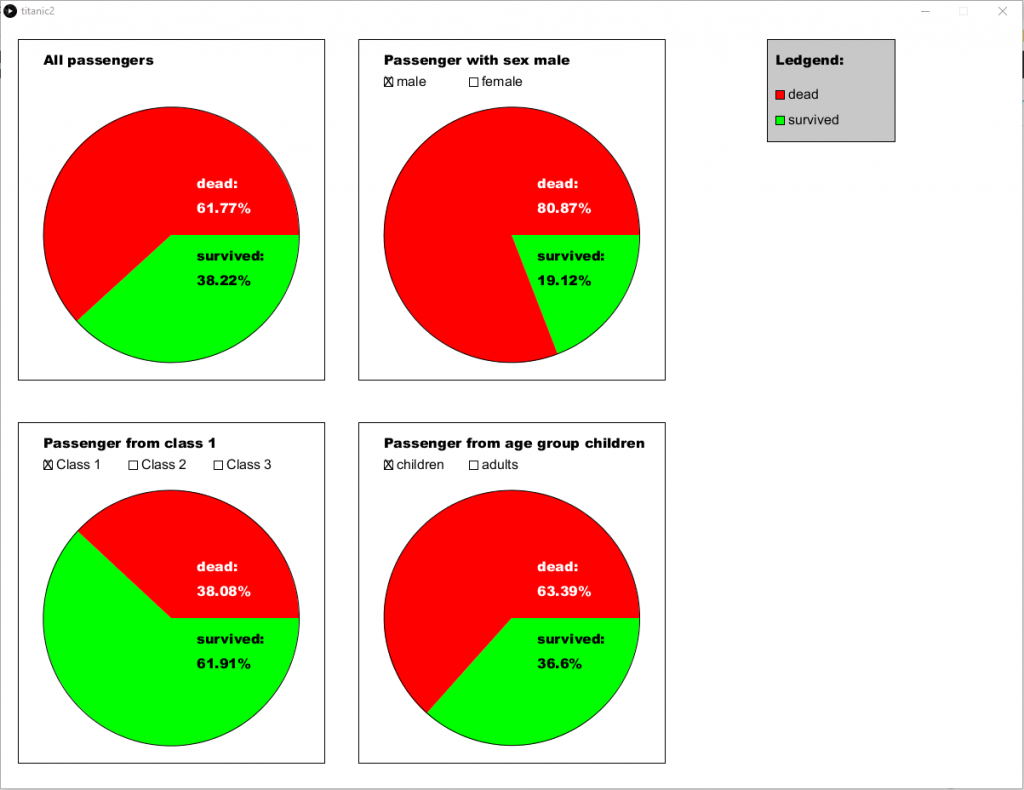
I used pie charts to show the percentage of how many people survived and how many died. This infographic is interactive because you can select the passenger’s class, the sex and the age and combine different selections to get a result. Therefore, I divided the program into seven scripts, which can be seen below. Only the ui.R-Script is for the user interface. The other scripts are used for the function.
# ui.R
#Loading libraries
library(shiny)

#Loading other used scripts

# Define UI for application that draws a histogram
shinyUI(fluidPage(

  # Application title
  titlePanel("Titanic"),

  # The inout-fields
  sidebarLayout(
    sidebarPanel(
      radioButtons("pclassIn", "Passenger's class:",
                   c("All" = "all",
                     "First class" = "first",
                     "Secound class" = "secound",
                     "Third class" = "third")),
      selectInput("sexIn", "Passenger's sex:",
                   c("all" = "all",
                     "female" = "female",
                     "male" = "male")),
      selectInput("ageIn",
                   "Passenger's age",
                   c("All" = "all",
                     "Children" = "children",
                     "Adults" = "adults"))

    ),

    # Show a plot of the generated distribution
    mainPanel(
       plotOutput("pieChart")
    )
  )
))
#server.R
#Loading libraries
# for Shiny
library(shiny)

#for csv
library(readr)
library(data.table)

#Loading other used scripts
source("scripts/pieChart.R")
source("scripts/passenger.R")
source("scripts/filterPassenger.R")
source("scripts/allPass.R")
source("scripts/getSlices.R")

# Loading Data
titanicData <- read.csv2("data/titanic.csv")
setnames(titanicData, old = "ï..pclass", new = "pclass")
countedPassenger <- filterPassenger(titanicData)
lbls <- c("survived", "not survived")

# Define server logic required to draw a histogram
shinyServer(function(input, output) {

  output$pieChart <- renderPlot({
    slices <- getSlices(countedPassenger, input)
    pieChart(slices, lbls)
  })

})
#allPass.R
allPass <- function(actuellPassenger, survivedAll, deadAll){
  # Survived or dead
  if(actuellPassenger$survived == 1) {
    survivedAll <- survivedAll + 1
  }

  if(actuellPassenger$survived == 0){
    deadAll <- deadAll + 1
  }

  allPassenger <- list("survived" = survivedAll, "dead" = deadAll)

  return(allPassenger)
}
# pieChart.R
# Source: https://www.statmethods.net/graphs/pie.html

pieChart <- function(slices , lbls){

  pct <- round(slices/sum(slices)*100)

  lbls <- paste(lbls, pct) # add percents to labels

  lbls <- paste(lbls,"%",sep="") # ad % to labels

  colors = c("green" ,"red")

  pie(slices,labels = lbls, col=colors,
      main="Pie Chart of Titanic")
}
# passenger.R
passenger <- function(titanicData, myRow){
  #print(titanicData$pclass[myRow])
  pclass <- titanicData$pclass[myRow]
  #pclass <- 1
  sex <- titanicData$sex[myRow]
  age <- titanicData$age[myRow]
  survived <- titanicData$survived[myRow]

  pass <- list("pclass" = pclass, "sex" = sex, "age" = age, "survived" = survived)
  return(pass)
}
# getSlices.R
getSlices <- function(countedPassenger, input){
  choiceClass <- input$pclassIn;
  choiceSex <- input$sexIn;
  choiceAge <- input$ageIn;
  sclices <- c(0,0);
  lbls <- c();

  #all
  if(choiceClass == "all" && choiceSex == "all" && choiceAge == "all"){
    slices <- c(countedPassenger$allPassenger$survived, countedPassenger$allPassenger$dead)
  }
  # class
  if(choiceClass != "all" && choiceSex == "all" && choiceAge == "all"){
    # first class
    if(choiceClass == "first"){
      slices <- c(countedPassenger$firstClassPassenger$survived, countedPassenger$firstClassPassenger$dead)
    }
    # secound class
    if(choiceClass == "secound"){
      slices <- c(countedPassenger$secoundClassPassenger$survived, countedPassenger$secoundClassPassenger$dead)
    }
    # third class
    if(choiceClass == "third"){
      slices <- c(countedPassenger$thirdClassPassenger$survived, countedPassenger$thirdClassPassenger$dead)
    }
  }

  # sex
  if(choiceClass == "all" && choiceSex != "all" && choiceAge == "all"){
    # female
    if(choiceSex == "female"){
      slices <- c(countedPassenger$femalePassenger$survived, countedPassenger$femalePassenger$dead)
    }
    # male
    if(choiceSex == "male"){
      slices <- c(countedPassenger$malePassenger$survived, countedPassenger$malePassenger$dead)
    }
  }

  # age
  if(choiceClass == "all" && choiceSex == "all" && choiceAge != "all"){
    # children
    if(choiceAge == "children"){
      slices <- c(countedPassenger$childPassenger$survived, countedPassenger$childPassenger$dead)
    }
    # adults
    if(choiceAge == "adults"){
      slices <- c(countedPassenger$adultPassenger$survived, countedPassenger$adultPassenger$dead)
    }
  }

  # class sex
  if(choiceClass != "all" && choiceSex != "all" && choiceAge == "all"){
    # first class female
    if(choiceClass == "first" && choiceSex == "female"){
      slices <- c(countedPassenger$firstClassFemalePassenger$survived, countedPassenger$firstClassFemalePassenger$dead)
    }
    # first class male
    if(choiceClass == "first" && choiceSex == "male"){
      slices <- c(countedPassenger$firstClassMalePassenger$survived, countedPassenger$firstClassMalePassenger$dead)
    }
    # secound class female
    if(choiceClass == "secound" && choiceSex == "female"){
      slices <- c(countedPassenger$secoundClassFemalePassenger$survived, countedPassenger$secoundClassFemalePassenger$dead)
    }
    # secound class male
    if(choiceClass == "secound" && choiceSex == "male"){
      slices <- c(countedPassenger$secoundClassMalePassenger$survived, countedPassenger$secoundClassMalePassenger$dead)
    }
    # third class female
    if(choiceClass == "third" && choiceSex == "female"){
      slices <- c(countedPassenger$thirdClassFemalePassenger$survived, countedPassenger$thirdClassFemalePassenger$dead)
    }
    # third class male
    if(choiceClass == "third" && choiceSex == "male"){
      slices <- c(countedPassenger$thirdClassMalePassenger$survived, countedPassenger$thirdClassMalePassenger$dead)
    }
  }

  # class age
  if(choiceClass != "all" && choiceSex == "all" && choiceAge != "all"){
    # first class children
    if(choiceClass == "first" && choiceAge == "children"){
      slices <- c(countedPassenger$firstClassChildPassenger$survived, countedPassenger$firstClassChildPassenger$dead)
    }
    # first class adults
    if(choiceClass == "first" && choiceAge == "adults"){
      slices <- c(countedPassenger$firstClassAdultPassenger$survived, countedPassenger$firstClassAdultPassenger$dead)
    }
    # secound class children
    if(choiceClass == "secound" && choiceAge == "children"){
      slices <- c(countedPassenger$secoundClassChildPassenger$survived, countedPassenger$secoundClassChildPassenger$dead)
    }
    # secound class adults
    if(choiceClass == "secound" && choiceAge == "adults"){
      slices <- c(countedPassenger$secoundClassAdultPassenger$survived, countedPassenger$secoundClassAdultPassenger$dead)
    }
    # third class children
    if(choiceClass == "third" && choiceAge == "children"){
      slices <- c(countedPassenger$thirdClassChildPassenger$survived, countedPassenger$thirdClassChildPassenger$dead)
    }
    # third class adults
    if(choiceClass == "third" && choiceAge == "adults"){
      slices <- c(countedPassenger$thirdClassAdultPassenger$survived, countedPassenger$thirdClassAdultPassenger$dead)
    }
  }

  # sex age
  if(choiceClass == "all" && choiceSex != "all" && choiceAge != "all"){
    # female children
    if(choiceSex == "female" && choiceAge == "children"){
      slices <- c(countedPassenger$femaleChildPassenger$survived, countedPassenger$femaleChildPassenger$dead)
    }
    # male children
    if(choiceSex == "male" && choiceAge == "children"){
      slices <- c(countedPassenger$maleChildPassenger$survived, countedPassenger$maleChildPassenger$dead)
    }
    # female adults
    if(choiceSex == "female" && choiceAge == "adults"){
      slices <- c(countedPassenger$femaleAdultPassenger$survived, countedPassenger$femaleAdultPassenger$dead)
    }
    # male adults
    if(choiceSex == "male" && choiceAge == "adults"){
      slices <- c(countedPassenger$maleAdultPassenger$survived, countedPassenger$maleAdultPassenger$dead)
    }
  }

  # class sex age
  if(choiceClass != "all" && choiceSex != "all" && choiceAge != "all"){
    # first class female children
    if(choiceClass == "first" && choiceSex == "female" && choiceAge == "children"){
      slices <- c(countedPassenger$firstClassFemaleChildPassenger$survived, countedPassenger$firstClassFemaleChildPassenger$dead)
    }
    # first class male children
    if(choiceClass == "first" && choiceSex == "male" && choiceAge == "children"){
      slices <- c(countedPassenger$firstClassMaleChildPassenger$survived, countedPassenger$firstClassMaleChildPassenger$dead)
    }
    # first class female adult
    if(choiceClass == "first" && choiceSex == "female" && choiceAge == "adults"){
      slices <- c(countedPassenger$firstClassFemaleAdultPassenger$survived, countedPassenger$firstClassFemaleAdultPassenger$dead)
    }
    # first class adult
    if(choiceClass == "first" && choiceSex == "male" && choiceAge == "adults"){
      slices <- c(countedPassenger$firstClassMaleAdultPassenger$survived, countedPassenger$firstClassMaleAdultPassenger$dead)
    }

    # secound class female children
    if(choiceClass == "secound" && choiceSex == "female" && choiceAge == "children"){
      slices <- c(countedPassenger$secoundClassFemaleChildPassenger$survived, countedPassenger$secoundClassFemaleChildPassenger$dead)
    }
    # secound class male children
    if(choiceClass == "secound" && choiceSex == "male" && choiceAge == "children"){
      slices <- c(countedPassenger$secoundClassMaleChildPassenger$survived, countedPassenger$secoundClassMaleChildPassenger$dead)
    }
    # secound class female adult
    if(choiceClass == "secound" && choiceSex == "female" && choiceAge == "adults"){
      slices <- c(countedPassenger$secoundClassFemaleAdultPassenger$survived, countedPassenger$secoundClassFemaleAdultPassenger$dead)
    }
    # secound class adult
    if(choiceClass == "secound" && choiceSex == "male" && choiceAge == "adults"){
      slices <- c(countedPassenger$secoundClassMaleAdultPassenger$survived, countedPassenger$secoundClassMaleAdultPassenger$dead)
    }

    # third class female children
    if(choiceClass == "third" && choiceSex == "female" && choiceAge == "children"){
      slices <- c(countedPassenger$thirdClassFemaleChildPassenger$survived, countedPassenger$thirdClassFemaleChildPassenger$dead)
    }
    # third class male children
    if(choiceClass == "third" && choiceSex == "male" && choiceAge == "children"){
      slices <- c(countedPassenger$thirdClassMaleChildPassenger$survived, countedPassenger$thirdClassMaleChildPassenger$dead)
    }
    # third class female adult
    if(choiceClass == "third" && choiceSex == "female" && choiceAge == "adults"){
      slices <- c(countedPassenger$thirdClassFemaleAdultPassenger$survived, countedPassenger$thirdClassFemaleAdultPassenger$dead)
    }
    # third class adult
    if(choiceClass == "third" && choiceSex == "male" && choiceAge == "adults"){
      slices <- c(countedPassenger$thirdClassMaleAdultPassenger$survived, countedPassenger$thirdClassMaleAdultPassenger$dead)
    }
  }

  #print(slices)
  return(slices)
}
# filterPassenger.R
filterPassenger <- function(titanicData){
  allPassenger <-list("survived" = 0, "dead" = 0);
  femalePassenger <-list("survived" = 0, "dead" = 0);
  malePassenger <-list("survived" = 0, "dead" = 0);
  childPassenger <-list("survived" = 0, "dead" = 0);
  adultPassenger <-list("survived" = 0, "dead" = 0);
  femaleChildPassenger <-list("survived" = 0, "dead" = 0);
  maleChildPassenger <-list("survived" = 0, "dead" = 0);
  femaleAdultPassenger <-list("survived" = 0, "dead" = 0);
  maleAdultPassenger <-list("survived" = 0, "dead" = 0);
  firstClassPassenger <-list("survived" = 0, "dead" = 0);
  secoundClassPassenger <-list("survived" = 0, "dead" = 0);
  thirdClassPassenger <-list("survived" = 0, "dead" = 0);
  firstClassFemalePassenger <-list("survived" = 0, "dead" = 0);
  secoundClassFemalePassenger <-list("survived" = 0, "dead" = 0);
  thirdClassFemalePassenger <-list("survived" = 0, "dead" = 0);
  firstClassMalePassenger <-list("survived" = 0, "dead" = 0);
  secoundClassMalePassenger <-list("survived" = 0, "dead" = 0);
  thirdClassMalePassenger <-list("survived" = 0, "dead" = 0);
  firstClassChildPassenger  <-list("survived" = 0, "dead" = 0);
  secoundClassChildPassenger  <-list("survived" = 0, "dead" = 0);
  thirdClassChildPassenger  <-list("survived" = 0, "dead" = 0);
  firstClassAdultPassenger  <-list("survived" = 0, "dead" = 0);
  secoundClassAdultPassenger  <-list("survived" = 0, "dead" = 0);
  thirdClassAdultPassenger  <-list("survived" = 0, "dead" = 0);
  firstClassFemaleChildPassenger  <-list("survived" = 0, "dead" = 0);
  secoundClassFemaleChildPassenger  <-list("survived" = 0, "dead" = 0);
  thirdClassFemaleChildPassenger  <-list("survived" = 0, "dead" = 0);
  firstClassFemaleAdultPassenger  <-list("survived" = 0, "dead" = 0);
  secoundClassFemaleAdultPassenger  <-list("survived" = 0, "dead" = 0);
  thirdClassFemaleAdultPassenger  <-list("survived" = 0, "dead" = 0);
  firstClassMaleChildPassenger  <-list("survived" = 0, "dead" = 0);
  secoundClassMaleChildPassenger  <-list("survived" = 0, "dead" = 0);
  thirdClassMaleChildPassenger  <-list("survived" = 0, "dead" = 0);
  firstClassMaleAdultPassenger  <-list("survived" = 0, "dead" = 0);
  secoundClassMaleAdultPassenger  <-list("survived" = 0, "dead" = 0);
  thirdClassMaleAdultPassenger  <-list("survived" = 0, "dead" = 0);

  for (myRow in 1:1309){
    actuellPassenger <- passenger(titanicData, myRow)
    #print(paste0("class: ", actuellPassenger$pclass))

    allPassenger <- allPass(actuellPassenger,allPassenger$survived, allPassenger$dead)
    #print(paste0("survived: ", allPassenger$survived))
    #print(paste0("dead: ", allPassenger$dead))

    # Survived or dead first class
    if(actuellPassenger$pclass == 1){
      firstClassPassenger <- allPass(actuellPassenger, firstClassPassenger$survived, firstClassPassenger$dead)
    }

    # Survived or dead secound class
    if(actuellPassenger$pclass == 2){
      secoundClassPassenger <- allPass(actuellPassenger, secoundClassPassenger$survived, secoundClassPassenger$dead)
    }

    # Survived or dead third class
    if(actuellPassenger$pclass == 3){
      thirdClassPassenger <- allPass(actuellPassenger, thirdClassPassenger$survived, thirdClassPassenger$dead)
    }

    if(!is.na(actuellPassenger$sex)){
      # Survived or dead female
      if(actuellPassenger$sex == "female"){
        femalePassenger <- allPass(actuellPassenger, femalePassenger$survived, femalePassenger$dead)
      }

      # Survived or dead male
      if(actuellPassenger$sex == "male"){
        malePassenger <- allPass(actuellPassenger, malePassenger$survived, malePassenger$dead)
      }

      # Survived or dead first class female
      if(actuellPassenger$pclass == 1 && actuellPassenger$sex == "female"){
        firstClassFemalePassenger <- allPass(actuellPassenger, firstClassFemalePassenger$survived, firstClassFemalePassenger$dead)
      }

      # Survived or dead secound class female
      if(actuellPassenger$pclass == 2 && actuellPassenger$sex == "female"){
        secoundClassFemalePassenger <- allPass(actuellPassenger, secoundClassFemalePassenger$survived, secoundClassFemalePassenger$dead)
      }

      # Survived or dead third class female
      if(actuellPassenger$pclass == 3 && actuellPassenger$sex == "female"){
        thirdClassFemalePassenger <- allPass(actuellPassenger, thirdClassFemalePassenger$survived, thirdClassFemalePassenger$dead)
      }

      # Survived or dead first class male
      if(actuellPassenger$pclass == 1 && actuellPassenger$sex == "male"){
        firstClassMalePassenger <- allPass(actuellPassenger, firstClassMalePassenger$survived, firstClassMalePassenger$dead)
      }

      # Survived or dead secound class male
      if(actuellPassenger$pclass == 2 && actuellPassenger$sex == "male"){
        secoundClassMalePassenger <- allPass(actuellPassenger, secoundClassMalePassenger$survived, secoundClassMalePassenger$dead)
      }

      # Survived or dead third class male
      if(actuellPassenger$pclass == 3 && actuellPassenger$sex == "male"){
        thirdClassMalePassenger <- allPass(actuellPassenger, thirdClassMalePassenger$survived, thirdClassMalePassenger$dead)
      }
    }

    if(!is.na(actuellPassenger$age)){
      #print(actuellPassenger$age)
      # Survived or dead child
      if(actuellPassenger$age <= 18){
        childPassenger <- allPass(actuellPassenger, childPassenger$survived, childPassenger$dead)
      }

      # Survived or dead adult
      if(actuellPassenger$age >= 18){
        adultPassenger <- allPass(actuellPassenger, adultPassenger$survived, adultPassenger$dead)
      }

      # Survived or dead first class child
      if(actuellPassenger$pclass == 1 && actuellPassenger$age <= 18){
        firstClassChildPassenger <- allPass(actuellPassenger, firstClassChildPassenger$survived, firstClassChildPassenger$dead)
      }

      # Survived or dead secound class child
      if(actuellPassenger$pclass == 2 && actuellPassenger$age <= 18){
        secoundClassChildPassenger <- allPass(actuellPassenger, secoundClassChildPassenger$survived, secoundClassChildPassenger$dead)
      }

      # Survived or dead third class child
      if(actuellPassenger$pclass == 3 && actuellPassenger$age <= 18){
        thirdClassChildPassenger <- allPass(actuellPassenger, thirdClassChildPassenger$survived, thirdClassChildPassenger$dead)
      }

      # Survived or dead first class adult
      if(actuellPassenger$pclass == 1 && actuellPassenger$age >= 18){
        firstClassAdultPassenger <- allPass(actuellPassenger, firstClassAdultPassenger$survived, firstClassAdultPassenger$dead)
      }

      # Survived or dead secound class adult
      if(actuellPassenger$pclass == 2 && actuellPassenger$age >= 18){
        secoundClassAdultPassenger <- allPass(actuellPassenger, secoundClassAdultPassenger$survived, secoundClassAdultPassenger$dead)
      }

      # Survived or dead third class adult
      if(actuellPassenger$pclass == 3 && actuellPassenger$age >= 18){
        thirdClassAdultPassenger <- allPass(actuellPassenger, thirdClassAdultPassenger$survived, thirdClassAdultPassenger$dead)
      }
    }

    if(!is.na(actuellPassenger$age) && !is.na(actuellPassenger$sex)){
      # Survived or dead female child
      if(actuellPassenger$age <= 18 && actuellPassenger$sex == "female"){
        femaleChildPassenger <- allPass(actuellPassenger, femaleChildPassenger$survived, femaleChildPassenger$dead)
      }

      # Survived or dead female adult
      if(actuellPassenger$age >= 18 && actuellPassenger$sex == "female"){
        femaleAdultPassenger <- allPass(actuellPassenger, femaleAdultPassenger$survived, femaleAdultPassenger$dead)
      }

      # Survived or dead male child
      if(actuellPassenger$age <= 18 && actuellPassenger$sex == "male"){
        maleChildPassenger <- allPass(actuellPassenger, maleChildPassenger$survived, maleChildPassenger$dead)
      }

      # Survived or dead male adult
      if(actuellPassenger$age >= 18 && actuellPassenger$sex == "male"){
        maleAdultPassenger <- allPass(actuellPassenger, maleAdultPassenger$survived, maleAdultPassenger$dead)
      }

      # Survived or dead first class female child
      if(actuellPassenger$pclass == 1 && actuellPassenger$sex == "female" && actuellPassenger$age <= 18){
        firstClassFemaleChildPassenger <- allPass(actuellPassenger, firstClassFemaleChildPassenger$survived, firstClassFemaleChildPassenger$dead)
      }

      # Survived or dead secound class female child
      if(actuellPassenger$pclass == 2 && actuellPassenger$sex == "female" && actuellPassenger$age <= 18){
        secoundClassFemaleChildPassenger <- allPass(actuellPassenger, secoundClassFemaleChildPassenger$survived, secoundClassFemaleChildPassenger$dead)
      }

      # Survived or dead third class female child
      if(actuellPassenger$pclass == 3 && actuellPassenger$sex == "female" && actuellPassenger$age <= 18){
        thirdClassFemaleChildPassenger <- allPass(actuellPassenger, thirdClassFemaleChildPassenger$survived, thirdClassFemaleChildPassenger$dead)
      }

      # Survived or dead first class female adult
      if(actuellPassenger$pclass == 1 && actuellPassenger$sex == "female" && actuellPassenger$age >= 18){
        firstClassFemaleAdultPassenger <- allPass(actuellPassenger, firstClassFemaleAdultPassenger$survived, firstClassFemaleAdultPassenger$dead)
      }

      # Survived or dead secound class female adult
      if(actuellPassenger$pclass == 2 && actuellPassenger$sex == "female" && actuellPassenger$age >= 18){
        secoundClassFemaleAdultPassenger <- allPass(actuellPassenger, secoundClassFemaleAdultPassenger$survived, secoundClassFemaleAdultPassenger$dead)
      }

      # Survived or dead third class female adult
      if(actuellPassenger$pclass == 3 && actuellPassenger$sex == "female" && actuellPassenger$age >= 18){
        thirdClassFemaleAdultPassenger <- allPass(actuellPassenger, thirdClassFemaleAdultPassenger$survived, thirdClassFemaleAdultPassenger$dead)
      }
      # Survived or dead first class male child
      if(actuellPassenger$pclass == 1 && actuellPassenger$sex == "male" && actuellPassenger$age <= 18){
        firstClassMaleChildPassenger <- allPass(actuellPassenger, firstClassMaleChildPassenger$survived, firstClassMaleChildPassenger$dead)
      }

      # Survived or dead secound class male child
      if(actuellPassenger$pclass == 2 && actuellPassenger$sex == "male" && actuellPassenger$age <= 18){
        secoundClassMaleChildPassenger <- allPass(actuellPassenger, secoundClassMaleChildPassenger$survived, secoundClassMaleChildPassenger$dead)
      }

      # Survived or dead third class male child
      if(actuellPassenger$pclass == 3 && actuellPassenger$sex == "male" && actuellPassenger$age <= 18){
        thirdClassMaleChildPassenger <- allPass(actuellPassenger, thirdClassMaleChildPassenger$survived, thirdClassMaleChildPassenger$dead)
      }

      # Survived or dead first class male adult
      if(actuellPassenger$pclass == 1 && actuellPassenger$sex == "male" && actuellPassenger$age >= 18){
        firstClassMaleAdultPassenger <- allPass(actuellPassenger, firstClassMaleAdultPassenger$survived, firstClassMaleAdultPassenger$dead)
      }

      # Survived or dead secound class female adult
      if(actuellPassenger$pclass == 2 && actuellPassenger$sex == "female" && actuellPassenger$age >= 18){
        secoundClassMaleAdultPassenger <- allPass(actuellPassenger, secoundClassMaleAdultPassenger$survived, secoundClassMaleAdultPassenger$dead)
      }

      # Survived or dead third class female adult
      if(actuellPassenger$pclass == 3 && actuellPassenger$sex == "female" && actuellPassenger$age >= 18){
        thirdClassMaleAdultPassenger <- allPass(actuellPassenger, thirdClassMaleAdultPassenger$survived, thirdClassMaleAdultPassenger$dead)
      }
    }

  }
  return(list("allPassenger" = allPassenger,
              "femalePassenger" =  femalePassenger,
              "malePassenger" = malePassenger,
              "childPassenger" = childPassenger,
              "adultPassenger" = adultPassenger,
              "femaleChildPassenger" = femaleChildPassenger,
              "maleChildPassenger" = maleChildPassenger,
              "femaleAdultPassenger" = femaleAdultPassenger,
              "maleAdultPassenger" = maleAdultPassenger,
              "firstClassPassenger" = firstClassPassenger,
              "secoundClassPassenger" = secoundClassPassenger,
              "thirdClassPassenger" = thirdClassPassenger,
              "firstClassFemalePassenger" = firstClassFemalePassenger,
              "secoundClassFemalePassenger" = secoundClassFemalePassenger,
              "thirdClassFemalePassenger" = thirdClassFemalePassenger,
              "firstClassMalePassenger" = firstClassMalePassenger,
              "secoundClassMalePassenger" = secoundClassMalePassenger,
              "thirdClassMalePassenger" = thirdClassMalePassenger,
              "firstClassChildPassenger" = firstClassChildPassenger,
              "secoundClassChildPassenger" = secoundClassChildPassenger,
              "thirdClassChildPassenger" = thirdClassChildPassenger,
              "firstClassAdultPassenger" = firstClassAdultPassenger,
              "secoundClassAdultPassenger" = secoundClassAdultPassenger,
              "thirdClassAdultPassenger" = thirdClassAdultPassenger,
              "firstClassFemaleChildPassenger" = firstClassFemaleChildPassenger,
              "secoundClassFemaleChildPassenger" = secoundClassFemaleChildPassenger,
              "thirdClassFemaleChildPassenger" = thirdClassFemaleChildPassenger,
              "firstClassFemaleAdultPassenger" = firstClassFemaleAdultPassenger,
              "secoundClassFemaleAdultPassenger" = secoundClassFemaleAdultPassenger,
              "thirdClassFemaleAdultPassenger" = thirdClassFemaleAdultPassenger,
              "firstClassMaleChildPassenger" = firstClassMaleChildPassenger,
              "secoundClassMaleChildPassenger" = secoundClassMaleChildPassenger,
              "thirdClassMaleChildPassenger" = thirdClassMaleChildPassenger,
              "firstClassMaleAdultPassenger" = firstClassMaleAdultPassenger,
              "secoundClassMaleAdultPassenger" = secoundClassMaleAdultPassenger,
              "thirdClassMaleAdultPassenger" = thirdClassMaleAdultPassenger))

}
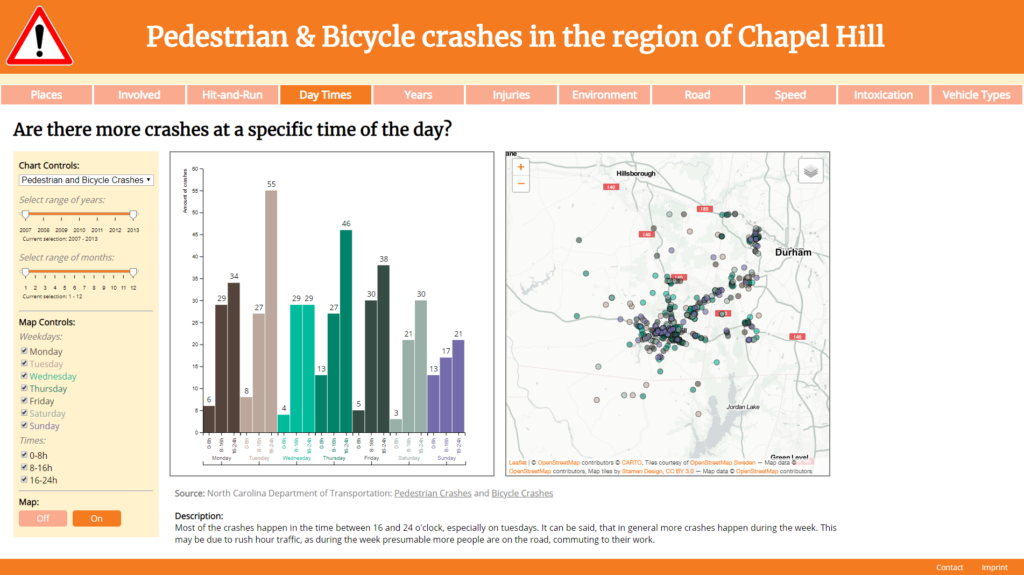
 Pedestrian & Bicycle crashes in the region of Chapel Hill: Where do the crashes took place?
")

")

")

")

")

")

")

")

")

")